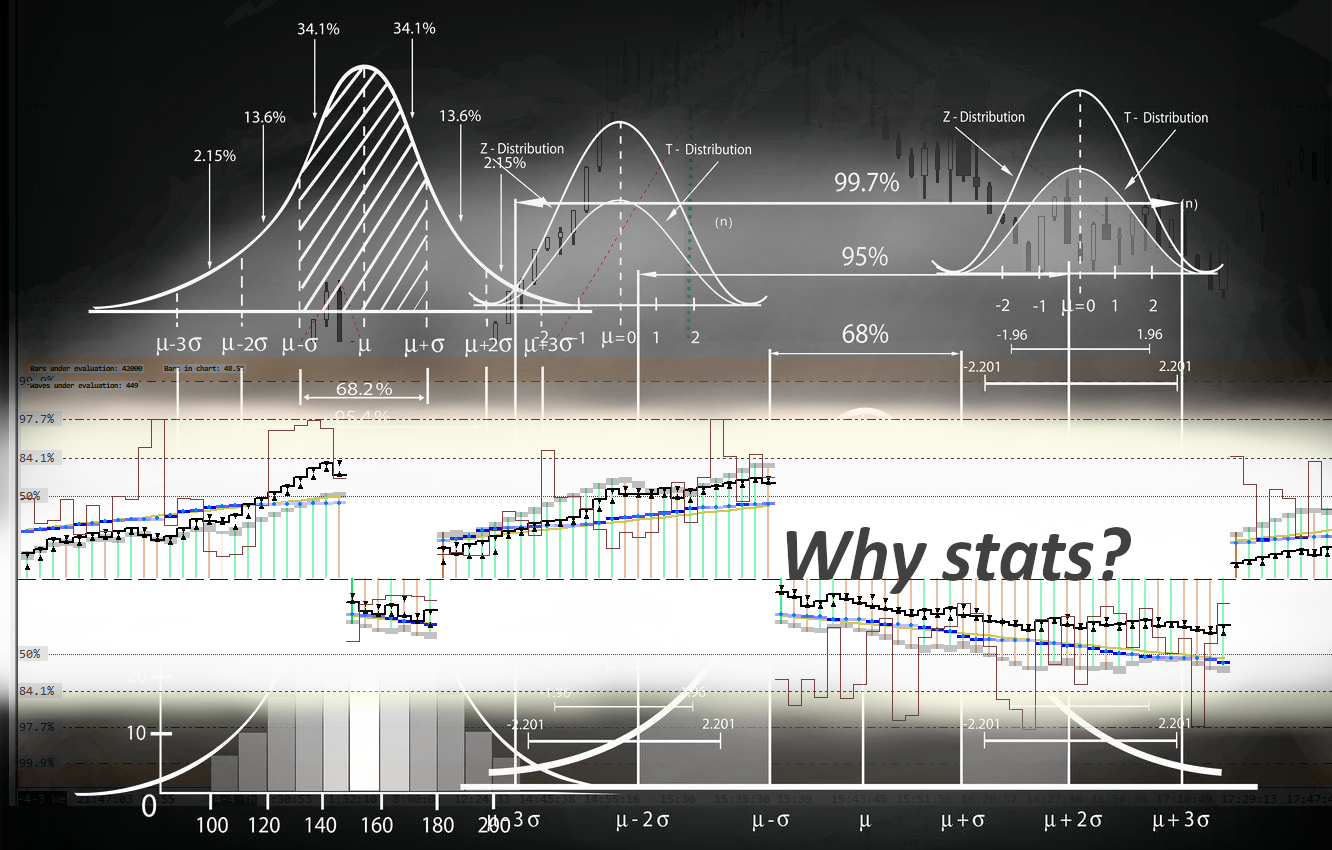
Why statistical evaluations of order flow data?
Compare data – fast and precise
Many of the development efforts within OrderFlowViz.com are pointed towards statistical evaluation. What started Excel-based found its way into Sierra Chart going through various iterations. The concepts were finally built in ACSIL (Sierra Chart’s C++ based development environment).
Outlining some of the advantages:
- Fundamentally, it normalizes the relevant elements of order flow and makes them comparable.
- Enables for a more in-depth view on intentions of market participants.
- Past and current events can be interpreted faster.
- Interpretation of past and current events can be done with more precision.
- Current market context can be evaluated with a high degree of precision.
- Speed and precision allow for seamless integration into automated trading systems.
- Simplifies the identification of various types of divergences.
- Acts as additional confirmation in case of having an active trading system that is purely based on price action and technical analysis.
- Enables generation of entirely new trading systems considering all elements of order flow.
- Statistical visualization supports to recognize short term and real-time market sentiment at the hard right edge.
Interpretation of data is fast as it can be put on regular bar charts (more bars fit on a screen than with a footprint chart). The evaluations are light-weight enough to avoid laggy charts.
Let's say we look at chart going a few weeks back containing tens of thousands of bars. Maybe we can somehow plot or show total volume and bid-ask delta volume beneath every bar. We try to look at the up/down price movements and find patterns how the volume influences these movements. We will see all sorts of combinations - Large movements with preceding high volume candles, turning points with a lot of positive delta, turning points where the last bars actually hold negative delta and so on and so forth.
| The goal is to get actionable insights of the market. |
Depending on how we keep track of the data and how we record these observations we might spend more or less time. Very detailed efforts and studying charts on different time frames and different products might take weeks.
In many cases the output we generate is vague and far from trustworthy. Often it is also incomplete as we might not be able to consider all relevant data in our chart.
This is what we dedicated ourselves to at OrderFlowViz.com. Performing these evaluations among Price ranges with including volume, delta volume (Bid-Ask difference), number of trades and a measure of order flow velocity. The calculations must happen within a few Milliseconds and all order flow characteristics of every price move must be comparable through the help of statistics. More specifically, we are translating the numbers into Z-scores and probability figures.
Observing that a move made a price range of a Z-score of 1 (1 standard deviation from the mean, which it reaches only 84% of the time) on positive delta at 0.5 Z-score (which is half a SD above average - 67%) and total volume and trades quantity was only at 50% for instance, will give us much more insight what was going on. This kind of data representation allows us to include it into the decision making process.
Same as price action patterns, there are as well repeating order flow patterns.
Whatever we are looking at to make our trading decisions, order flow data representations in such comparable fashion will definitely support us in deciding to get in, keep holding or getting out of a trade.
| Applying statistics in signal finding and trade execution. |
However, we don't stop here. We are also developing trading tools, which allow us to generate trading signals and furthermore receiving statistical data that project price targets and success rates based on the inputted patterns/generated signals.
This basically eliminates the process of back-testing. It happens on the hard right edge displaying the entry price and the average target price with a 70% zone. It also displays the following reversal price target (to determine the positioning of stop loss order) and then the target zone of the next price move and so on.
Additional evaluations will furthermore support the decision-making while being in a trade.
These things are only possible through fast calculation times.
| Previous | Next |
