FOR-TAR-31
Price Target Forecasting
Price Forecasting Tools
CHF 54.00
/month
Choose your plan
Click a plan to subscribe
Includes
- Price Target Forecasting module
- Control study
Forecasting
Probability
Sierra Chart
Description
Connects to any signal output in Sierra Chart and answers the question: when this signal has appeared historically, how far did price typically move?
The module analyses all historical occurrences of the selected signal, then displays three probability-based price targets directly on the chart at every new trigger.
Probability Levels
| Level | Meaning |
|---|---|
| 84% target | Price reached at least this far in ~84% of historical cases — conservative expectation |
| 50% target | Average price movement — median historical outcome |
| 16% target | Only ~16% of cases turned before here — aggressive/maximum expectation |
These levels adjust for real market distributions. Non-normal outcomes are handled with three distribution methods: Auto, Cornish-Fisher (moderate skew), and Strictly Monotonic (extreme fat tails).
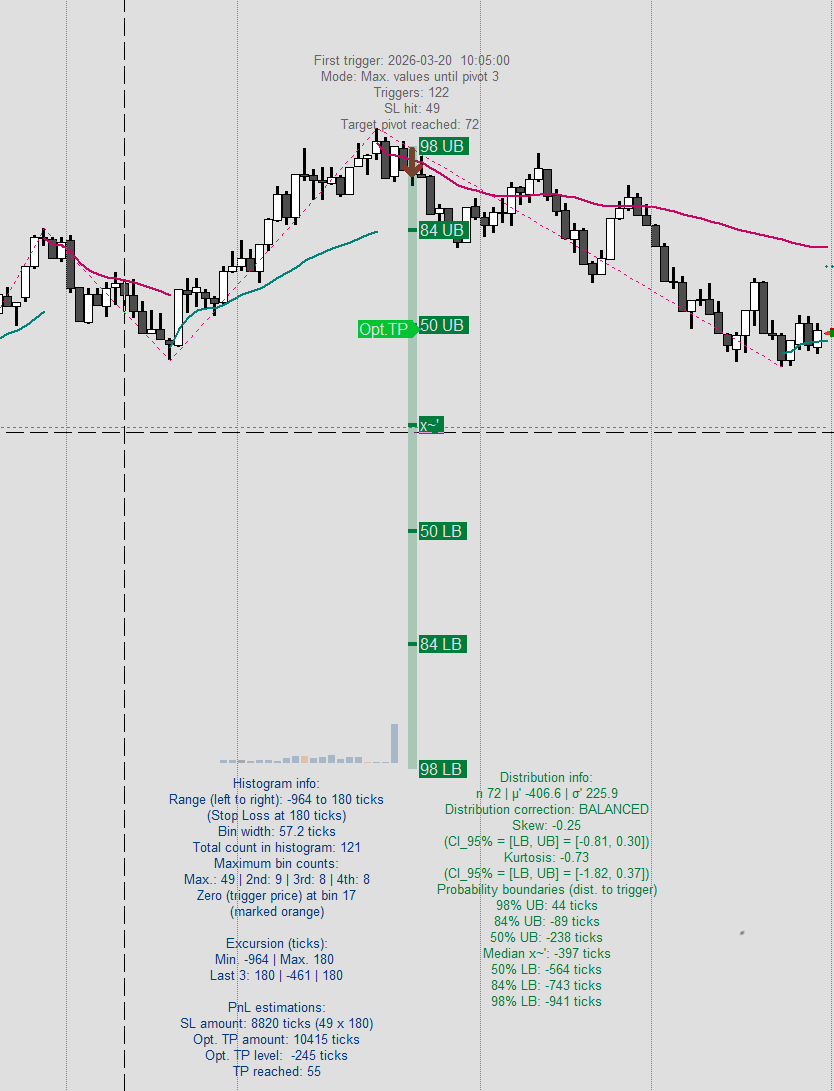
What You See on the Chart
- Trigger marker with sequential number at each signal — track sample size as it grows
- Probability bar showing the three target levels
- Distribution histogram — 20-bin frequency visualization of historical outcomes
- Statistical metrics — mean, standard deviation, skewness, kurtosis per signal
Sample Size and Confidence
| Triggers | Interpretation |
|---|---|
| 1–10 | Preliminary — statistics forming |
| 10–30 | Pattern emerging — levels becoming meaningful |
| 30+ | Statistically significant |
| 100+ | High confidence — robust foundation |
Technical Details
- Processes backward through ~250,000 historical bars
- Calculation time ~20 ms on a modern PC at full history
- All historical occurrences visible on chart for review
- Non-repainting — historical markers remain fixed
Requirements
- Sierra Chart trading platform
- Level 1 tick-by-tick data with bar timestamps
- ofv Control Study (included)
- A signal source — any study subgraph works; OrderFlowViz signal generation products are recommended
×
![Screenshot]()